
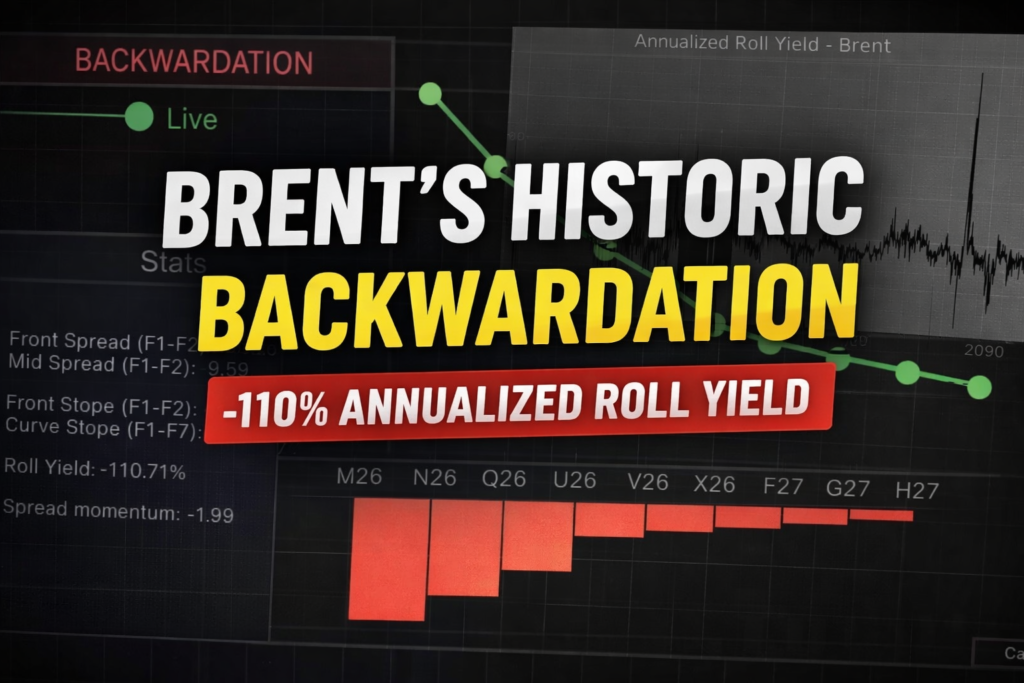
The Brent forward curve is sending one of the strongest signals the oil market has produced in decades — and it’s not subtle.
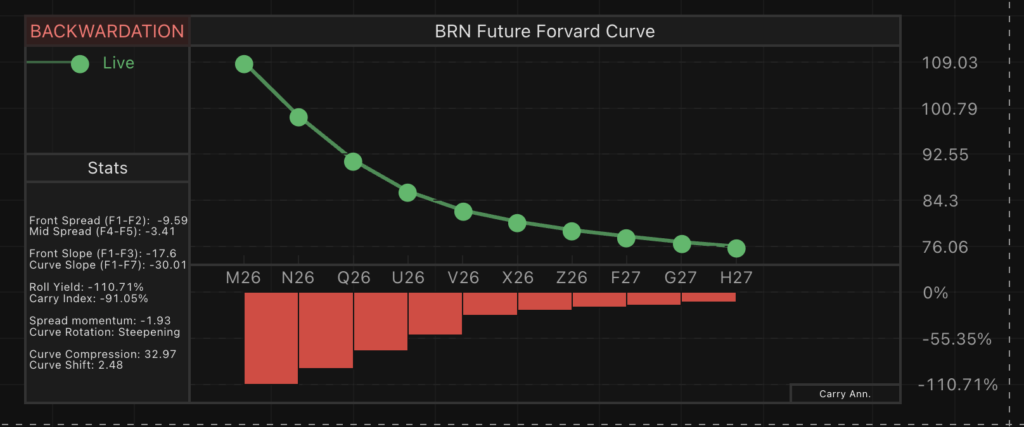
The front of the curve has collapsed relative to deferred contracts, pushing the annualized roll yield between the first and second contract to around -110%. By any historical standard, this is extreme. In fact, comparable readings have only been seen a handful of times — March 1991, April 1996, and August 2000 — and even then, not quite at today’s magnitude.
This is not just backwardation. This is stress.
A Market Paying Almost Anything for “Now”
In commodity markets, backwardation reflects a simple reality:
Immediate supply is more valuable than future supply.
But the current structure goes far beyond normal tightness. A front spread approaching -$10 between the first two contracts implies that market participants are willing to pay a massive premium to secure crude today rather than wait even a few weeks.
That kind of pricing doesn’t emerge gradually. It tends to appear when:
- Physical inventories are tight or rapidly declining
- Supply chains are constrained
- Buyers are forced into the spot market
In short, the system is under pressure.
Why -110% Roll Yield Matters
Roll yield is often an abstract concept — until it isn’t.
At -110% annualized, the cost of holding a long position in front-month Brent futures is enormous. Investors rolling exposure forward are effectively “bleeding” value at a historic rate. This is one of the most punitive environments imaginable for passive long commodity strategies.
But that same dynamic creates the opposite incentive elsewhere:
- Storage becomes unattractive → inventories are drawn down
- Physical holders are rewarded for selling immediately
- The curve self-reinforces tightness in the prompt market
This is how backwardation can accelerate into extreme territory — it actively discourages the very behavior (storage) that would normally stabilize prices.
Rare, But Not Without Precedent
The last times we saw comparable levels of front-end stress were:
- March 1991 — in the aftermath of the Gulf War
- April 1996 — during a period of tightening balances and supply disruptions
- August 2000 — ahead of a broader commodity upcycle
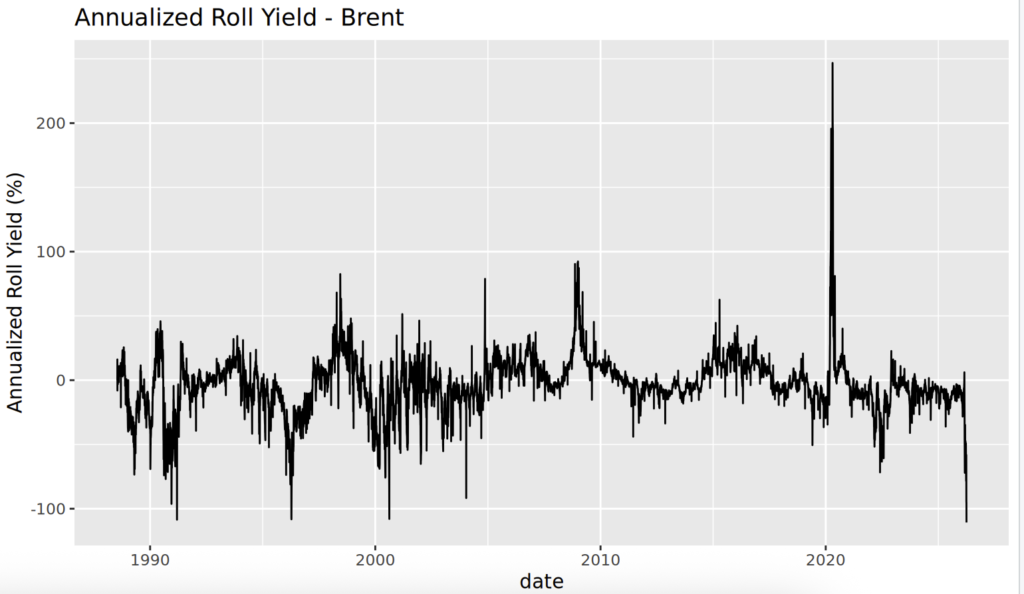
Each episode shared a common feature: acute short-term imbalance, not necessarily a long-term shortage.
That distinction matters.
The forward curve is not forecasting where oil prices will be in a year — it is reflecting the urgency of supply today.
What the Curve Is Really Saying
At its core, the Brent curve is delivering a very clear message:
The issue is not future supply — it is the availability of barrels right now.
This time, the driver is not abstract tightness or gradual imbalance. It is a clear geopolitical shock. The escalation of conflict involving Iran and the disruption of flows through the Strait of Hormuz — a critical artery for global oil exports — has created an immediate and tangible supply risk.
When a meaningful share of global seaborne crude is suddenly at risk, the market reacts where it matters most: the front of the curve.
The result is mechanical:
- Buyers rush to secure prompt cargoes
- Physical availability tightens sharply
- Near-term prices surge relative to deferred barrels
Regardless of how long the disruption lasts, the impact is already visible:
The market is scrambling for immediate supply, and pricing crude today at a significant premium to crude tomorrow.
Opportunity, Risk, and What Comes Next
Extreme backwardation creates sharp asymmetries across the market:
Winners
- Physical traders with access to crude
- Producers selling into elevated spot prices
- Those positioned for continued tightness
Losers
- Passive long investors rolling futures
- Storage operators
- Anyone relying on stable curve structure
However, history also offers a warning.
These conditions rarely persist indefinitely. Once supply constraints ease — whether through increased production, demand softening, or logistical normalization — the front of the curve can reprice violently.
In other words, the same steep structure that signals scarcity today can unwind just as quickly.
Final Thought
A triple-digit negative roll yield is not just a market signal — it’s a market alarm.
The Brent curve is no longer quietly indicating tightness; it is aggressively pricing immediacy. Whether this reflects genuine scarcity or a temporary dislocation will determine the next phase of the oil market.
But one thing is clear:
Right now, the market doesn’t just want oil — it needs it now.