
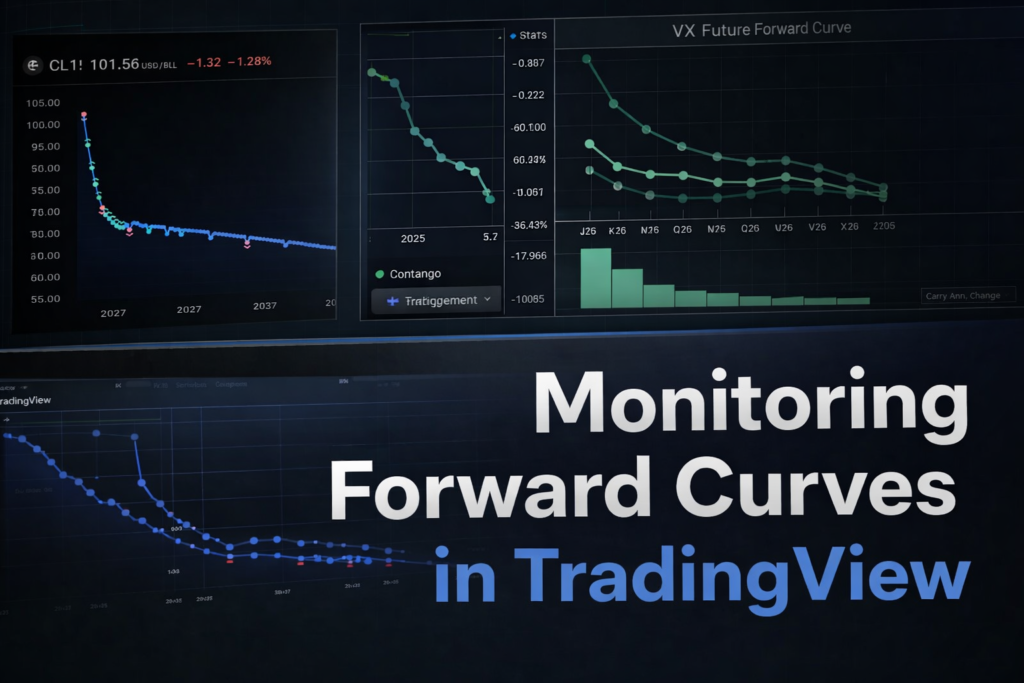
From Built-In Tools to Advanced Curve Analytics
Understanding the forward curve is one of the biggest edges a trader can develop—yet most retail traders completely ignore it.
They focus on price.
Professionals focus on structure.
The forward curve tells you how the market prices time.
What Is a Forward Curve (and Why It Matters)
A forward curve shows prices of futures contracts across different expiries.
Instead of asking:
“Where is price now?”
You ask:
“How is the market pricing the future?”
This gives you insight into:
- Market expectations
- Liquidity stress
- Supply/demand imbalance
- Volatility regimes
And most importantly:
👉 Positioning opportunities across time
The Built-In Forward Curve in TradingView
Most traders don’t realize this, but TradingView already provides a native forward curve view.
Instead of manually stitching contracts together, you can access a dedicated term structure page.
👉 Example:
Crude Oil Forward Curve (CL)
https://www.tradingview.com/symbols/NYMEX-CL1!/forward-curve/
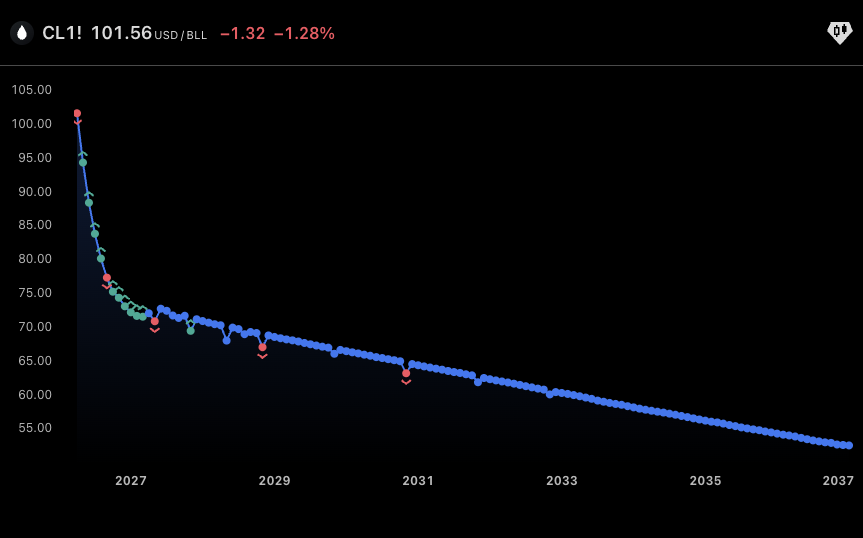
What this gives you:
- A clean curve across expirations
- Instant view of:
- Contango vs backwardation
- Curve steepness
- Front vs long-dated pricing
- No need to manually load multiple contracts
This is the fastest way to understand how the market is pricing the future.
The Limitation
While the built-in tool is great for visualization, it has one key drawback:
👉 It’s static and descriptive, not analytical.
You can see:
- The shape of the curve
But you can’t easily measure:
- Curve compression/expansion
- Historical extremes
- Structural shifts over time
In other words:
It shows you what the curve looks like
But not what it means
Step 2: Free Script — Forward Curve Visualization Tool
To bridge the gap, I built a free tool: https://www.tradingview.com/script/8k2Kkt4g-Forward-Curve-Visualization-Tool/
Forward Curve Visualization Tool
What this script does
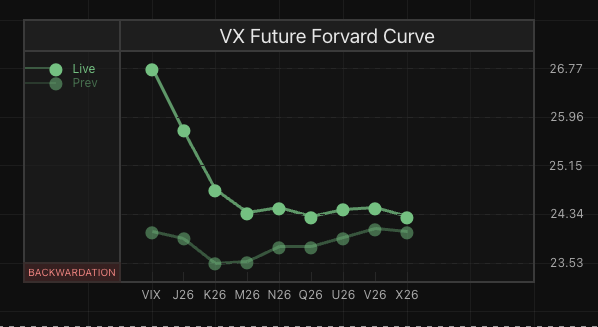
Instead of switching between pages, this tool brings the forward curve directly onto your chart.
- Keeps the curve always visible alongside the price
- Let’s compare the current structure vs. the past periods
- Filters to major contracts only (no noise)
- Allows filtering by liquidity, so you focus on what actually trades
What this unlocks
- Immediate recognition of curve shape and shifts
- Clear identification of contango vs backwardation
- Ability to track how the curve evolves over time
- A cleaner, more actionable view of real market structure
Now you’re not just looking at a snapshot —
You’re tracking the curve as a living signal inside your workflow.
Step 3: Pro Tool — FSL – Forward Curve Monitor
The real edge comes from quantifying the curve.
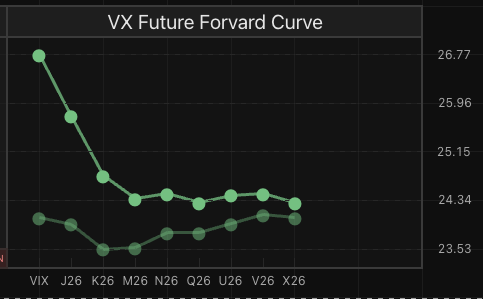
🔹 FSL – Forward Curve Monitor
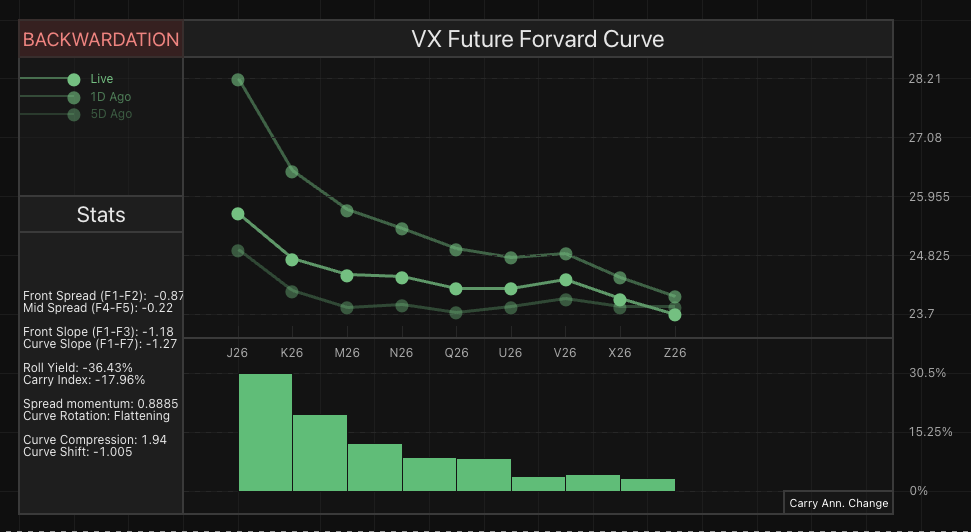
https://www.tradingview.com/script/V83nqNjg-FSL-Forward-Curve-Monitor/
This is not just visualization — it’s analysis.
Key features:
- Curve slope measurement
- Compression/expansion tracking
- Historical curve regimes
- Signal detection (extreme structures)
Why this matters:
Most traders react to price.
But professionals react to:
- Curve compression → potential expansion
- Extreme backwardation → stress/opportunity
- Flat curves → mispricing of risk
This is how you move from:
👉 Chart reading
to
👉 Market structure trading
What Most Traders Are Missing
If you only trade:
- Spot price
- Single futures contract
You are ignoring:
❌ Time structure
❌ Risk pricing
❌ Institutional positioning
The forward curve is where:
👉 Hedgers
👉 Institutions
👉 Volatility traders
…actually operate.
Final Thoughts
Monitoring the forward curve is not optional if you want to level up.
Start simple:
- Use TradingView’s built-in comparison
Then improve:
- Use the Forward Curve Visualization Tool
Then gain an edge:
- Use FSL – Forward Curve Monitor
Because in modern markets:
Price tells you what is happening
The curve tells you what comes next