
If you only trade spot markets or CFDs, you’re missing some of the most important information in financial markets.
Most retail traders analyze:
- Spot price charts
- Technical indicators
- Support and resistance
- Volume on the current instrument
But professional traders — especially in commodities, indices, and crypto derivatives — focus heavily on futures market data.
Why?
Because spot shows price.
Futures show positioning, pressure, and structure.
And structure is where the real signals live.
Why Futures Markets Matter (Even If You Trade Spot)
Even if you never trade futures contracts directly, futures markets influence:
- Commodity pricing (oil, gold, wheat, coffee)
- Index behavior (S&P 500, Nasdaq, DAX)
- Crypto funding and leverage dynamics
- Institutional positioning
The futures market is often the primary price discovery venue.
Ignoring it is like analyzing a company’s stock without looking at earnings.
1. Term Structure: What the Futures Curve Is Telling You
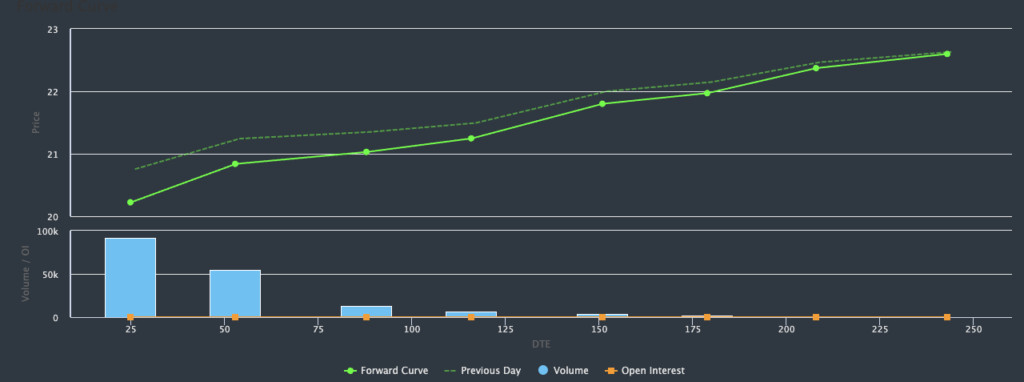
A futures market is not a single price — it’s a forward curve.
Each expiration month trades at a different level.
The shape of this curve contains valuable information.
Contango (Upward Sloping Curve)
- Future contracts trade higher than near-term contracts
- Often signals an abundant supply
- Common in calm, well-supplied markets
- Typical in equity index futures during normal conditions
Backwardation (Inverted Curve)
- Near-term contracts trade above deferred months
- Signals short-term supply tightness
- Often appears during stress or strong demand
For example, strong backwardation in oil futures often signals tight physical supply long before spot traders fully react.
Spot charts do not show this structural information.
2. Open Interest: Is the Move Supported by New Money?
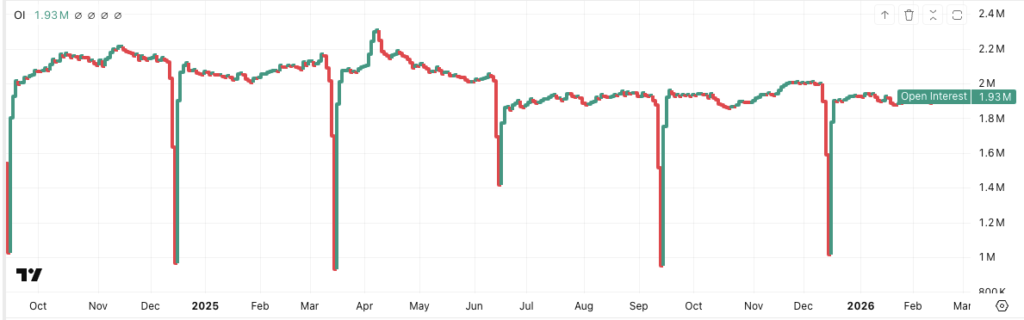
Open Interest (OI) measures the total number of outstanding futures contracts.
It helps answer a critical question:
Is this move driven by new positions — or by closing trades?
Price Up + Open Interest Up
- New money entering
- Strong conviction
- Trend potentially sustainable
Price Up + Open Interest Down
- Short covering
- Position reduction
- Potentially weaker move
Two identical price breakouts can have completely different implications depending on open interest behavior.
Most CFD traders never see this distinction.
3. Calendar Spreads: Early Warning Signals
Professional traders don’t always trade the outright price.
They trade calendar spreads — the difference between two contract months.
For example:
- Front month vs second month (F1–F2)
- Short-term vs long-term expectations
When spreads widen or invert, it often signals:
- Shifting supply-demand dynamics
- Inventory stress
- Structural regime change
Calendar spreads frequently move before spot prices break key technical levels.
If you monitor spreads, you often detect stress earlier.
4. Roll Dynamics and Institutional Flows
Large institutions, ETFs, and commodity funds must roll contracts from one month to another.
These rolls are:
- Scheduled
- Mechanical
- Large in size
Roll activity can create temporary price pressure in the front month.
Without understanding roll mechanics, traders may misinterpret:
- Artificial volume spikes
- Sudden weakness or strength
- Liquidity shifts
Futures structure helps separate mechanical flows from real demand.
5. Volume and Open Interest Distribution Across the Curve
Another overlooked signal is the concentration of activity.
Ask:
- Is open interest building in the front month?
- Or accumulating in deferred contracts?
- Is volume shifting along the curve?
If longer-dated contracts begin to accumulate significant open interest while spot remains flat, it may indicate longer-term positioning by institutions.
This kind of positioning shift is rarely visible on spot charts.
Why Retail Traders Often Ignore Futures Data
- Futures terminology feels complex
- Many brokers offer only CFDs
- Continuous contracts hide curve structure
- Education rarely covers term structure analysis
But complexity often hides opportunity.
Professional traders operate with this data daily.
Retail traders often don’t even know it exists.
Practical Example: Commodities and Crypto
In commodities like oil, wheat, silver, or coffee, term structure can indicate:
- Supply shortages
- Demand surges
- Storage constraints
In crypto markets, futures premiums and funding rates reflect:
- Leverage imbalance
- Aggressive long or short positioning
- Speculative overheating
These signals often precede major price moves.
The Core Difference
Spot price = Outcome.
Futures structure = Cause.
If you only analyze price action, you react.
If you analyze futures positioning, you anticipate.
Final Thoughts
If you trade:
- Commodities
- Index futures
- Crypto
- ETFs
- Or even individual stocks influenced by futures markets
And you ignore:
- Term structure
- Open interest trends
- Calendar spreads
- Roll dynamics
You are operating with incomplete information.
The market is not just a line on a chart.
It’s a structure.
And that structure contains signals that many traders never see.
Super