
Most traders focus only on price.
But in commodities, the real signal is often hidden in the curve.
Oil, coffee, natural gas, wheat — they don’t just trade at one price. They trade across multiple expiries. And the relationship between those contracts — called term structure — often tells you more than the chart itself.
If you use TradingView, you’ve probably noticed something:
It’s excellent for price charts.
But it doesn’t make backwardation or contango easy to analyze.
This guide explains:
- What backwardation really is
- Why it matters in commodities
- Why TradingView doesn’t show it properly by default
- How to calculate it manually
- How professionals monitor it
- How to automate it efficiently
What Is Backwardation?
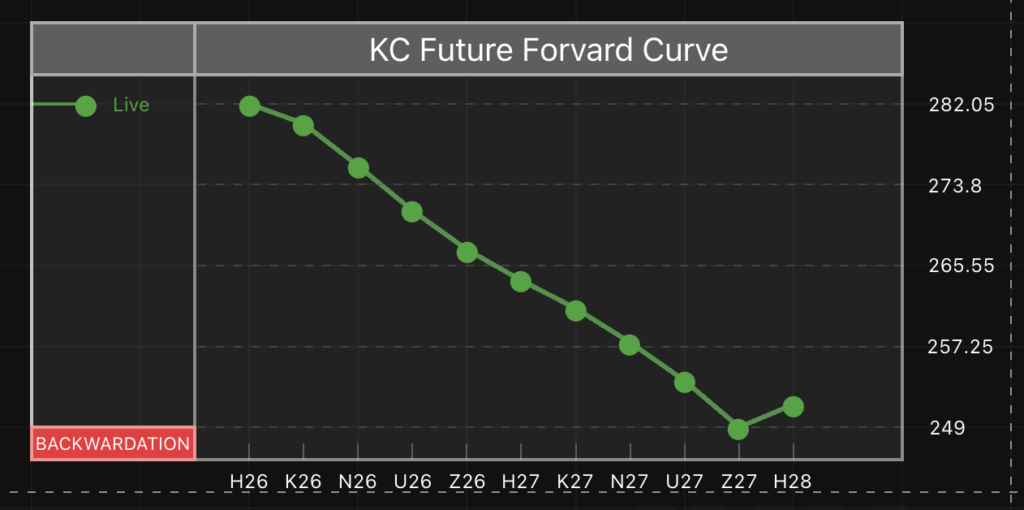
Backwardation occurs when near-term futures contracts trade at higher prices than longer-dated contracts.
In simple terms:
The market is willing to pay more for immediate delivery than for delivery later.
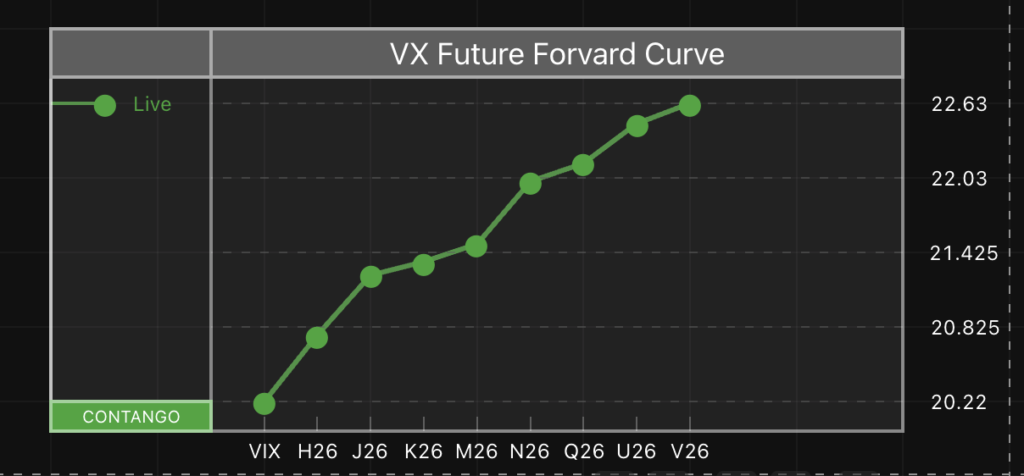
The opposite is contango, where longer-dated contracts trade above near contracts.
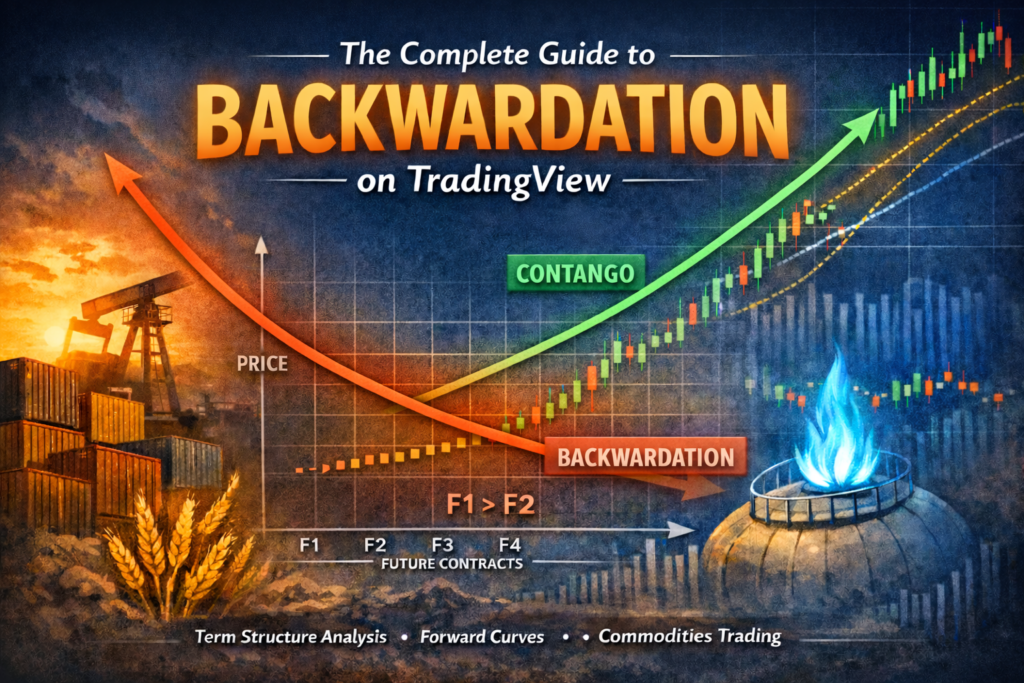
Backwardation vs Contango (Visual)
Upward sloping curve → Contango
Downward sloping curve → Backwardation
Why Backwardation Matters in Commodities
Backwardation is not just a curve shape. It reflects real physical market pressure.
In commodities, it often signals:
- Tight inventories
- Strong spot demand
- Supply disruptions
- Seasonal shortages
- High convenience yield
For example:
- Crude oil during supply shocks
- Coffee during harvest shortages
- Natural gas before winter
When the front contract trades above later contracts, the market is effectively saying:
“We need the commodity now.”
That urgency can matter more than any moving average.
What Backwardation Can Signal
- Short-term bullish pressure
- Strong spot demand
- Potential roll yield advantage
- Structural tightness
What Contango Can Signal
- Oversupply
- Storage-driven pricing
- Carry trade environment
- Weak immediate demand
Many retail traders trading CFDs or spot never see this signal — because they only watch a single chart.
Why TradingView Doesn’t Show Backwardation Properly
TradingView is excellent for charting price, but term structure analysis is not native.
By default:
- You see continuous contracts (like CL1!)
- Contracts are auto-rolled
- No full curve visualization
- No DTE normalization
- No slope analytics
Retail traders think they are analyzing “oil” or “coffee.”
In reality, they are looking at:
- Front-month contract
- Continuous adjusted data
- Or a CFD
The curve — where backwardation lives — remains hidden.
How to See Backwardation on TradingView (Manually)
You can monitor backwardation manually. It just requires extra work.
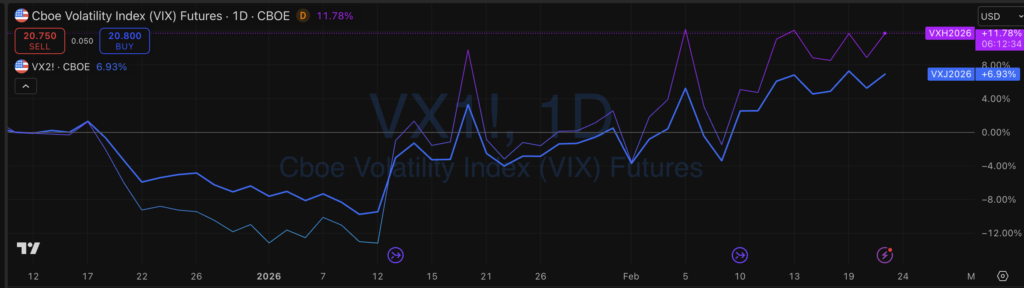
Method 1: Plot Multiple Contracts
For example, in crude oil:
CL1!
CL2!
CL3!
Overlay them on the same chart.
If:
- CL1! > CL2! → backwardation
- CL1! < CL2! → contango
But this quickly becomes messy.
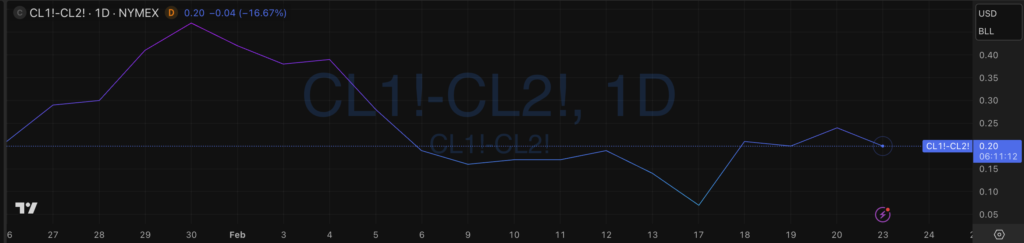
Method 2: Create a Spread Chart
You can plot:
CL1! - CL2!
If the spread is positive → backwardation
If negative → contango
Limitations:
- Not normalized
- Not annualized
- Hard to compare across assets
- Not scaled by time-to-expiry
How to Calculate Backwardation Properly
Most retail traders use raw spreads:
F1 - F2
But this is misleading.
A $1 spread in crude oil is not comparable to a $1 spread in coffee.
Better Method: Normalize by Time
(F1 - F2) / (DTE1 - DTE2)
This gives the slope per day.
Even Better: Annualized Carry
((F1 - F2) / F2) * (365 / DTE_diff)
Now you can:
- Compare oil vs coffee
- Compare different maturities
- Compare across time
This is how professional desks monitor curve steepness.
How Professionals Monitor Term Structure
Institutional traders rarely look at just one spread.
They monitor:
- Full forward curve
- Front vs 3M spread
- Front vs 6M spread
- Curve slope
- Curve momentum
- Z-scores of steepness
- Open interest distribution
- Roll yield
They also analyze:
- Inventory data
- Seasonality
- Volatility regimes
- Cross-asset structure
Backwardation isn’t binary.
It’s a regime.
And regimes matter.
Why Raw Spread Is Misleading
Let’s say:
Oil spread = $0.50
Coffee spread = $0.50
Same number.
Completely different meaning.
Oil volatility, contract size, and base price differ massively.
That’s why professionals use:
- Percentage carry
- Annualized carry
- Vol-adjusted slope
- DTE normalization
Without normalization, you’re comparing apples to oranges.
How to Automate Backwardation on TradingView
Monitoring curve structure manually is:
- Time-consuming
- Error-prone
- Hard to scale
- Impossible across many commodities
If you trade multiple futures markets, manually adding contracts and computing spreads becomes inefficient.
This is why I built a Forward Curve Visualization Tool for TradingView.
It allows you to:
- Visualize full term structure
- Detect backwardation and contango instantly
- Monitor curve slope
- Track changes over time
- Get an alert when backwardation is happening
- Analyze multiple contracts cleanly
Instead of guessing from a single chart, you see the structure clearly.
If you’re serious about trading commodities, you should be watching the curve — not just price.
Frequently Asked Questions
How do I check backwardation on TradingView?
You can manually compare CL1! and CL2! or create a spread chart. For full curve analysis, you need a dedicated term structure visualization approach.
Is backwardation bullish?
Often, but not always.
Backwardation typically signals tight supply or strong spot demand. However, price direction still depends on broader macro conditions and positioning.
Can you trade contango?
Yes. Contango environments often support carry trades and mean reversion strategies. The strategy depends on structure, volatility, and inventory dynamics.
What is the best backwardation indicator for TradingView?
An effective backwardation indicator should:
- Show full curve
- Normalize spreads
- Allow multi-contract comparison
- Track curve regime shifts
Manual spread charts are limited. Proper term structure visualization is significantly more powerful.
Final Thoughts
Most traders analyze price.
Professionals analyze structure.
Backwardation and contango are not academic concepts — they are live signals from the physical market.
TradingView makes price analysis easy.
But if you want to trade commodities seriously, you need to look beyond the front-month chart.
You need to look at the curve.