
Most traders obsess over price.
Some add volume.
Very few truly understand open interest.
Yet in futures markets, open interest (OI) is one of the most powerful tools available. It doesn’t tell you the direction. It tells you something deeper:
How much risk is currently active in the system?
And when you stop looking at individual contracts and start looking at total open interest across all maturities, the market structure becomes much clearer.
What Is Open Interest — Really?
Open interest represents the total number of outstanding futures contracts that remain open.
It increases when:
- A new buyer and a new seller initiate a position.
It decreases when:
- An existing buyer and seller close their positions.
Important clarifications:
- OI is not volume.
- OI does not tell you whether it’s long or short.
- OI measures participation and commitment, not direction.
Think of it this way:
Price shows movement.
Volume shows activity.
Open interest shows commitment.
Why Total Open Interest Matters More Than Individual Contracts
Most traders make a critical mistake:
They look at the open interest of a single contract — usually the front month.
That can be misleading.
Futures markets roll.
Positions migrate forward.
Liquidity shifts between maturities.
When you only track one contract:
- OI may appear to collapse near expiry.
- OI spikes may simply reflect roll activity.
- You may misinterpret structural positioning as short-term noise.
Instead, aggregate open interest across all listed maturities.
Total OI removes:
- Expiry distortions
- Roll-related noise
- Contract-specific liquidity effects
It shows the true size of exposure in the market.
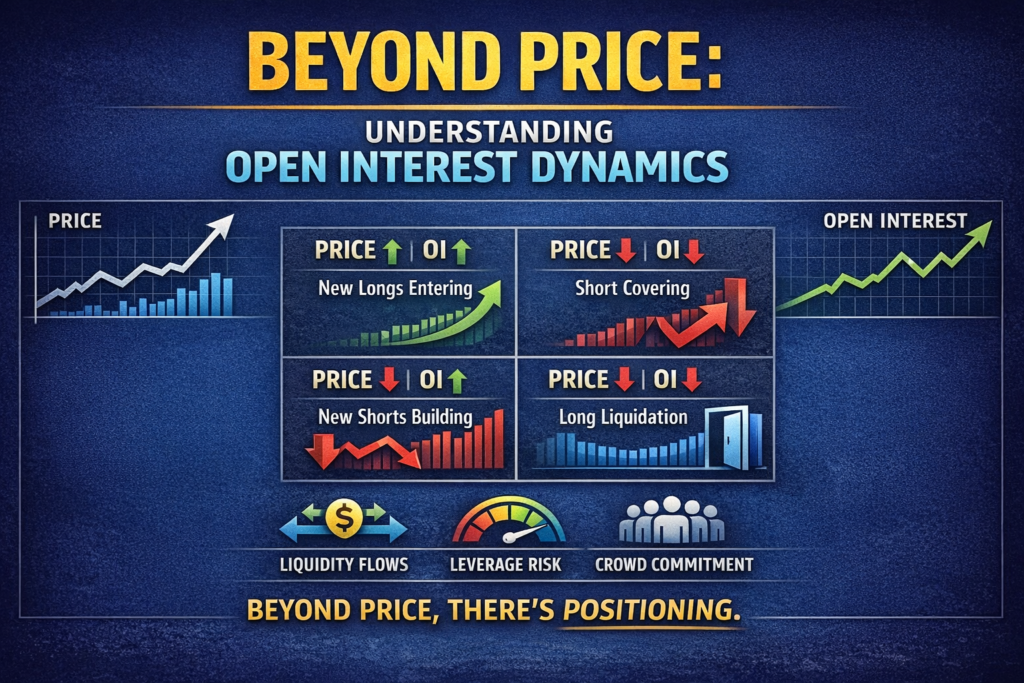
The Four Core OI Scenarios
Open interest only becomes meaningful when combined with price.
1️⃣ Price Up + OI Up
New positions are entering the market.
Interpretation:
- Trend confirmation
- Expanding participation
- Conviction building
- Potentially sustainable move
This is structural fuel entering the system.
2️⃣ Price Up + OI Down
Short covering.
Interpretation:
- Shorts closing positions
- Rally driven by position unwinding
- Often less sustainable
The move may continue — but it’s not powered by fresh participation.
3️⃣ Price Down + OI Up
New shorts entering.
Interpretation:
- Bearish conviction building
- Aggressive positioning
- Trend strengthening
This often signals expanding downside pressure.
4️⃣ Price Down + OI Down
Long liquidation.
Interpretation:
- Weak longs exiting
- Deleveraging
- Possible late-stage move
When OI falls sharply during declines, it can signal exhaustion.
Open Interest as a Risk Thermometer
Total open interest measures how much leverage and exposure exist in a market.
Rising Total OI Over Weeks or Months
This suggests:
- Increasing speculation or hedging demand
- Growing leverage
- Crowded positioning
High-OI environments often lead to:
- Larger squeezes
- Faster liquidations
- More explosive volatility
When positioning builds for long enough, the unwind can be violent.
Falling Total OI Over Time
This indicates:
- Deleveraging
- Shrinking participation
- Reduced conviction
It often appears:
- After major squeezes
- During trend transitions
- In low-conviction, choppy markets
Low OI markets tend to move more slowly — until new participation returns.
Why This Matters Even If You Don’t Trade Futures
You don’t need to trade futures to benefit from OI analysis.
Total open interest in:
- Equity index futures reflect leveraged exposure and risk appetite.
- Bond futures reflect macro positioning.
- Commodity futures reveal hedging and speculative flows.
If total index futures OI is expanding aggressively, leveraged exposure is building.
If OI collapses after a sharp move, a positioning reset is likely underway.
Spot traders can use this to:
- Anticipate squeezes
- Understand the conviction behind trends
- Identify fragile market structures
Common Mistakes When Interpreting OI
- Looking only at front-month contracts
- Ignoring roll dynamics
- Treating OI as directional bias
- Ignoring broader market structure
- Using OI without price context
Open interest is a contextual tool — not a standalone signal.
A Practical Framework
Before acting on open interest, ask:
- Is total OI rising or falling structurally?
- Is price trending or ranging?
- Are we near key technical levels?
- Is volatility expanding?
- Is this early trend expansion or late trend exhaustion?
The answers often reveal whether the move is being built — or being unwound.
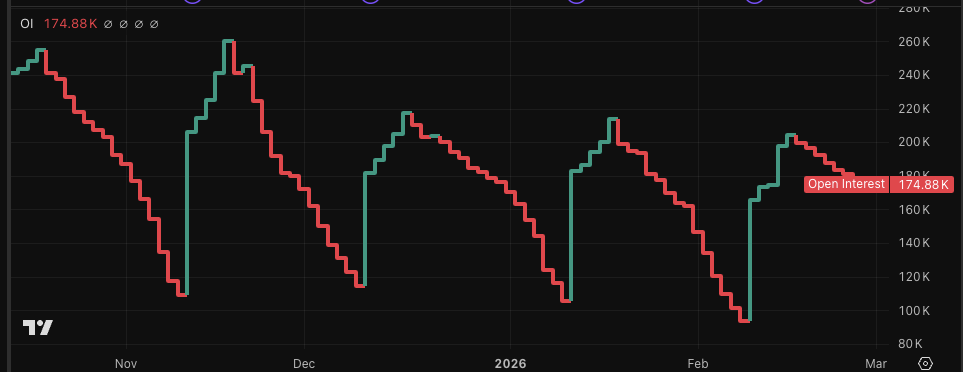
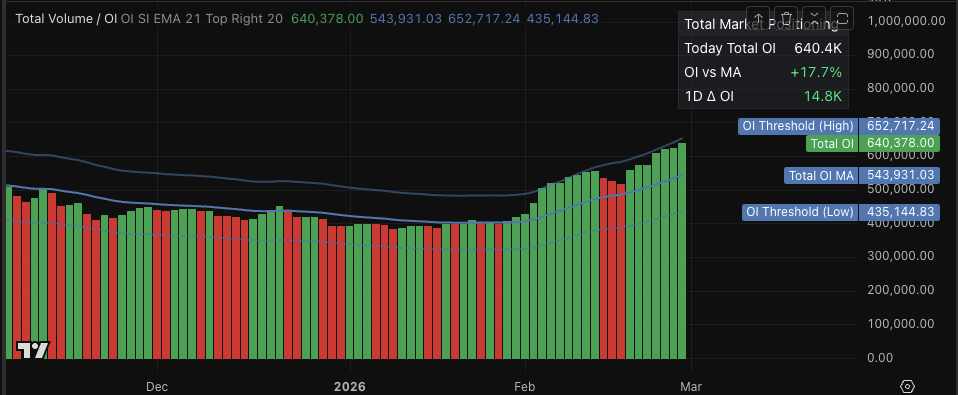
Track Total Open Interest Properly (Free TradingView Indicator)
One issue: platforms like TradingView don’t provide a clean way to see total open interest and total volume aggregated across all futures maturities.
You usually only see:
- Front-month data
- Individual contracts
- Roll-distorted OI drops
That can seriously mislead your interpretation.
So I built a free TradingView indicator that aggregates:
- Total open interest across maturities
- Total futures volume
- Clean structural exposure without roll noise
It allows you to track real participation, detect deleveraging, and understand whether trends are driven by new positioning or just position unwinds.
If you want to apply the framework from this article correctly, this makes the process much clearer.
The Deeper Insight
Open interest doesn’t predict direction.
It measures participation, leverage, and commitment.
Markets don’t reverse just because the price is overextended.
They reverse when positioning becomes fragile.
Total open interest helps you see when:
- A move is fueled by new conviction
- A rally is just short covering
- A decline is forced liquidation
- The system is overloaded with leverage
Beyond price lies structure.
And beyond structure lies positioning.
That’s where open interest becomes powerful.