
TradingView has great charting, but when it comes to futures structure analysis—things like forward curves, roll activity, and aggregated open interest—you usually need specialized tools.
Over the past months, I built a set of free indicators to fill that gap.
They are designed to work together and help traders analyze term structure, positioning, and carry dynamics directly inside TradingView.
This article introduces the tools and how they can be used as a complete futures analysis suite.
1. Forward Curve Visualization Tool
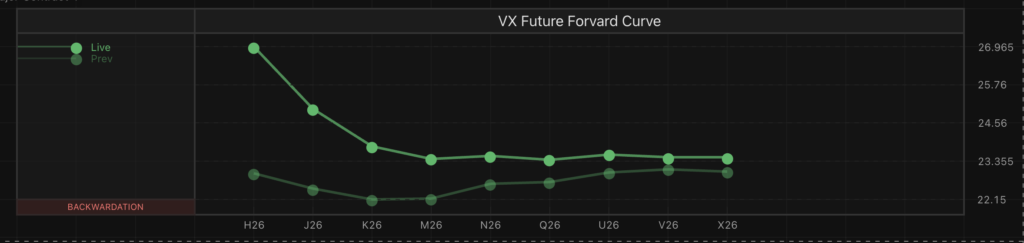
The forward curve is one of the most important concepts in futures markets.
It shows the relationship between contracts across maturities and reveals whether the market is in contango or backwardation.
My Forward Curve Visualization Tool plots the curve directly on the chart, so you can instantly see how different maturities are priced relative to one another.
Key features:
• Visualizes the full forward curve
• Highlights contango/backwardation regimes
• Makes curve shifts visible over time
• Works across multiple futures markets
This is particularly useful for:
- commodities traders
- Macro traders monitoring carry conditions
- identifying structural changes in the market
Indicator:
Forward Curve Visualization Tool
https://www.tradingview.com/script/8k2Kkt4g-Forward-Curve-Visualization-Tool/
2. Total Futures Volume & Open Interest (Aggregated Curve)
In many futures markets, liquidity is split across several contracts.
Looking only at the front month often hides what is happening in the broader market.
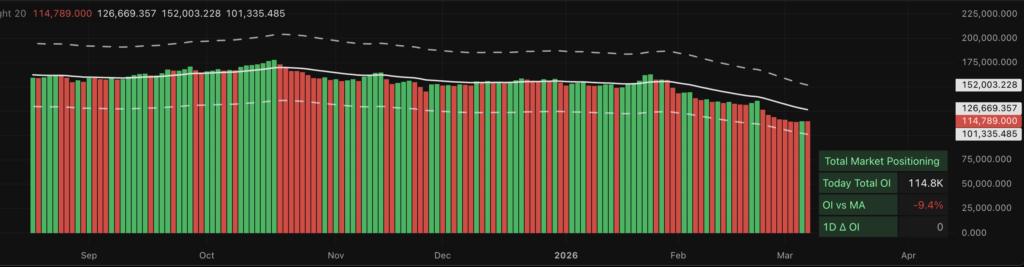
This tool aggregates volume and open interest across the futures curve, providing a clearer picture of overall market activity.
Key features:
• Aggregated total volume across contracts
• Aggregated open interest across the curve
• Helps identify true participation trends
• Useful for spotting accumulation or liquidation phases
Instead of looking at fragmented data across multiple charts, you get a single clean signal of market engagement.
Indicator:
Total Futures Volume & Open Interest
https://www.tradingview.com/script/5hcCc6xr-Total-Futures-Volume-Open-Interest-Aggregated-Curve/
3. Carry Monitor
Carry is one of the most important drivers of futures returns.
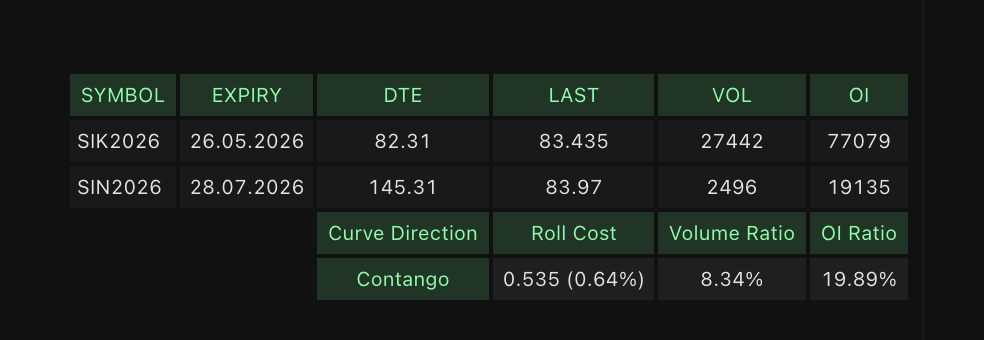
The Carry Monitor helps track the relationship between different maturities and estimate the carry embedded in the curve.

Key features:
• Tracks carry dynamics between contracts
• Helps identify positive vs negative carry environments
• Useful for macro and commodity traders
• Helps spot opportunities in term structure shifts
This tool helps answer questions like:
- Is the market paying you to hold the position?
- Is the curve steepening or flattening?
- Is carry becoming more attractive?
Indicator:
Carry Monitor
https://www.tradingview.com/script/kVfTPGtf-Carry-Monitor/
4. Future Roll Monitor
One of the most overlooked dynamics in futures markets is the roll process.
As traders move from the front contract to the next one, liquidity shifts across the curve. Monitoring this transition can reveal important information about positioning and market pressure.
The Future Roll Monitor tracks the roll activity between contracts.
Key features:
• Tracks liquidity migration across contracts
• Helps identify when the market is rolling
• Useful for timing contract transitions
• Provides insight into market positioning shifts
This is particularly helpful for traders who want to avoid liquidity traps during roll periods.
Indicator:
Future Roll Monitor
https://www.tradingview.com/script/bxKNkQln-Future-Roll-Monitor/
Why These Tools Work Best Together
Each tool focuses on a different dimension of futures markets:
| Tool | What it shows |
|---|---|
| Forward Curve Visualization | Market structure |
| Aggregated Volume & OI | Participation |
| Carry Monitor | Economic incentives |
| Future Roll Monitor | Liquidity transitions |
Used together, they provide a much richer view of futures markets than price alone.
You can quickly answer questions like:
- Is the market in backwardation or contango?
- Is participation increasing or decreasing?
- Is carry attractive?
- Is liquidity shifting to the next contract?
This combination gives traders a structural understanding of the market, not just price action.
Final Thoughts
TradingView is an excellent charting platform, but futures markets require additional tools to understand the full picture.
These indicators were designed to fill that gap and make term structure analysis accessible directly inside TradingView.
All tools are free and publicly available.
If you work with futures markets—commodities, rates, or indices—they can help you better understand how the curve, liquidity, and carry evolve over time.