
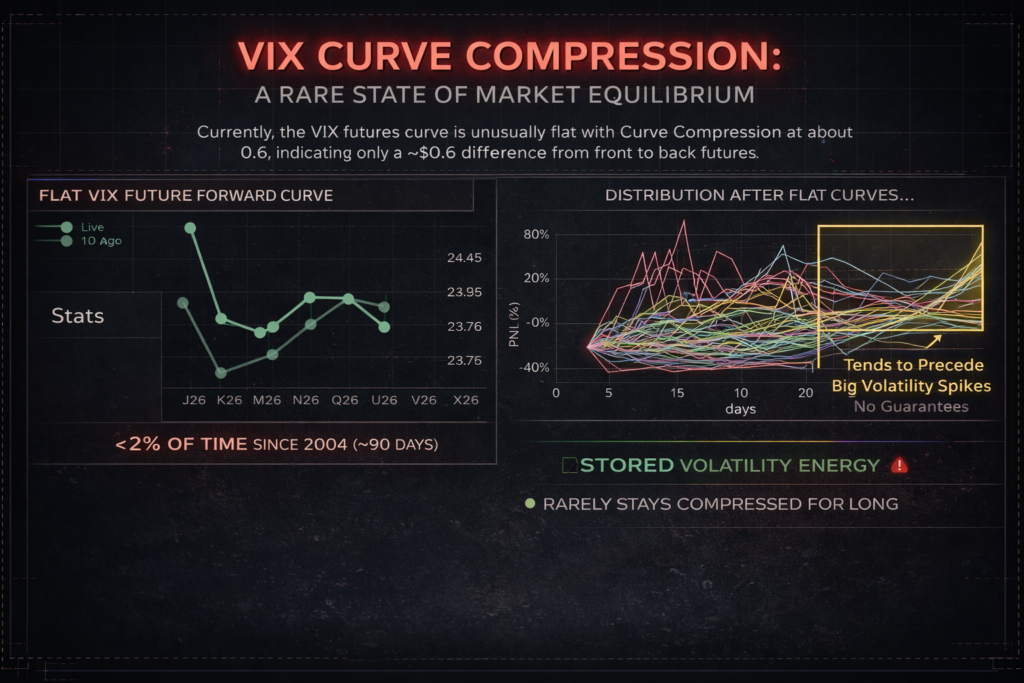
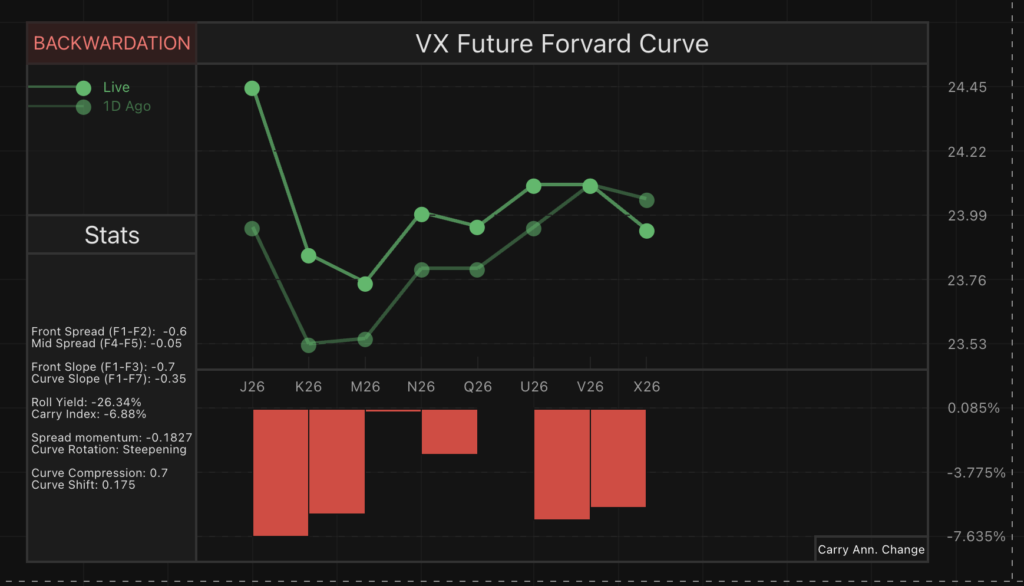
The VIX futures curve is currently exhibiting an unusually flat structure, with curve compression around ~0.6–0.7. In practical terms, this means the difference between the lowest and highest priced futures along the curve is only about $0.6 – an extremely tight range.
This type of structure is rare.
Looking back to 2004, such compression has occurred in less than ~2% of observations (~90 trading days total). In most environments, the VIX term structure is either in contango (upward-sloping) or backwardation (downward-sloping), but it is rarely compressed across maturities.
What Does a Flat VIX Curve Signal?
A compressed curve typically reflects market uncertainty about the path of volatility, rather than a clear directional expectation.
Several forces may be contributing:
- Event risk clustering
Markets may be pricing near-term and mid-term risks similarly (e.g., macro uncertainty, policy shifts, geopolitical risks). - Elevated spot volatility with anchored expectations
When spot VIX is elevated, but traders are unsure whether volatility will mean-revert or persist. - Hedging demand across maturities
Institutional flows can flatten the curve when protection is demanded not just short-term, but across the horizon. - Transition regimes
These setups often occur during shifts between calm → stress or stress → normalization.
What Happens After These Events?
Historically, these compression regimes have been followed by large dispersion in outcomes, but importantly:
➡️ They tend to precede volatility expansion
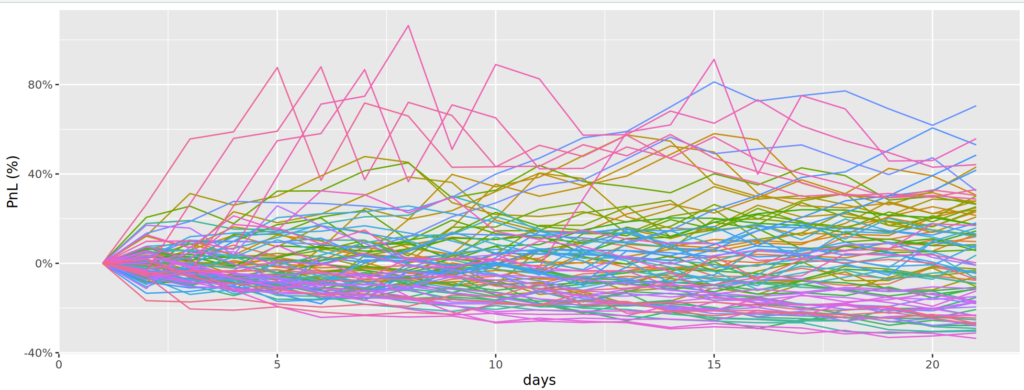
When analyzing the P&L of the front VIX future after such events:
- The distribution is wide
- But the right tail (volatility spikes) is significant
- Meaning: asymmetric upside in volatility
Notable historical examples include:
- November 2007 → Pre-GFC volatility expansion
- October & December 2018 → Volatility shock during equity sell-offs
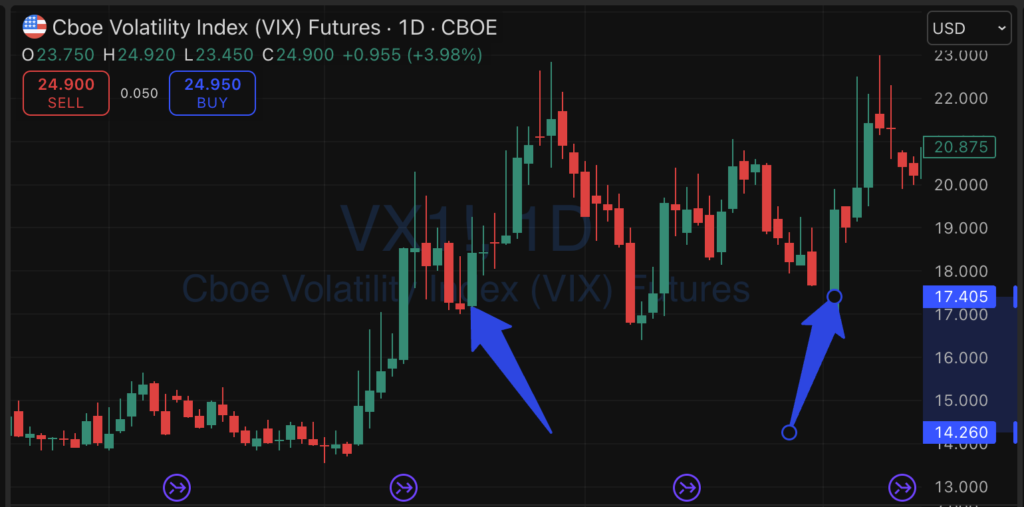
- Late March / Early April 2025 → Recent volatility spike
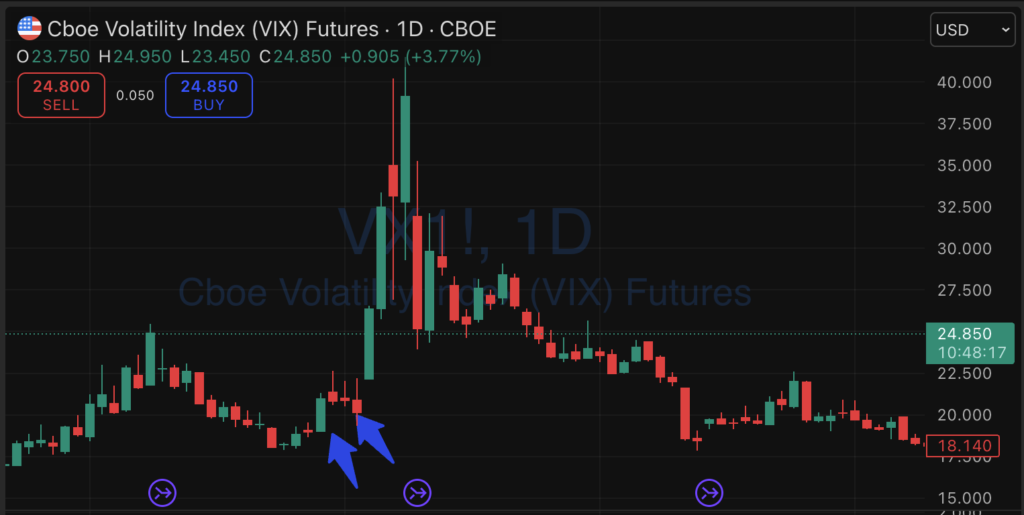
In each case, a compressed or stressed curve preceded meaningful volatility repricing.
Interpretation: Compression = Stored Energy
A useful way to think about this setup:
A flat VIX curve is like compressed volatility energy – it doesn’t stay compressed for long.
Markets are effectively saying:
- “We know something is coming”
- “We just don’t know when or how big”
This indecision often resolves through expansion, not stability.
Key Takeaways
- Current curve compression (~0.6) is statistically rare (<2% of time since 2004)
- It reflects uncertainty and regime transition, not calm
- Historically associated with future volatility spikes, though not guaranteed
- Risk is asymmetric: limited compression left, but meaningful expansion potential
Final Thought
This is not a signal in isolation—but it’s a condition worth paying attention to.
When volatility stops differentiating across time, it often means the market is about to start differentiating again – violently.