
Most traders analyze volume and open interest on the front-month futures contract.
That’s incomplete.
If you look at only one expiration, you are seeing just a fraction of market participation. The real positioning often happens across the entire futures curve.
Understanding aggregated futures data reveals:
- True capital commitment
- Institutional positioning
- Liquidity migration
- Structural shifts in expectations
- Roll dynamics
And this insight is valuable even if you don’t trade futures directly.
The Problem With Looking at Just One Contract
Across major exchanges like:
- CME Group
- NYMEX
- CBOT
Each futures instrument trades simultaneously across multiple expirations:
- Front month (F1)
- Second month (F2)
- Third month (F3)
- Deferred contracts further out on the curve
When you analyze only the front month:
- Volume collapses during roll
- Open interest may drop artificially
- Participation can appear weak
- Rotation can be misinterpreted as liquidation
In reality, activity often hasn’t disappeared — it has simply moved forward along the curve.
Why Total Volume Tells a Different Story
Aggregated volume across all expirations allows you to detect:
1️⃣ Genuine Participation Growth
If total volume expands across the curve, that’s real engagement.
If front-month volume declines but total volume remains stable, it’s likely contract rolling — not fading demand.
2️⃣ Institutional Position Building
Large participants frequently:
- Build exposure in deferred months
- Avoid congestion in the front contract
- Structure calendar spreads
Watching total open interest growth across expirations reveals accumulation that a single-contract view cannot show.
3️⃣ Structural Curve Shifts
When open interest migrates:
- From near months → deferred months
- Or deferred months → near months
It may reflect:
- Supply/demand expectations
- Storage stress (commodities)
- Interest rate expectations (bonds)
- Macro regime shifts
Why Aggregated Open Interest Is Critical
Open interest represents capital commitment, not just trading activity.
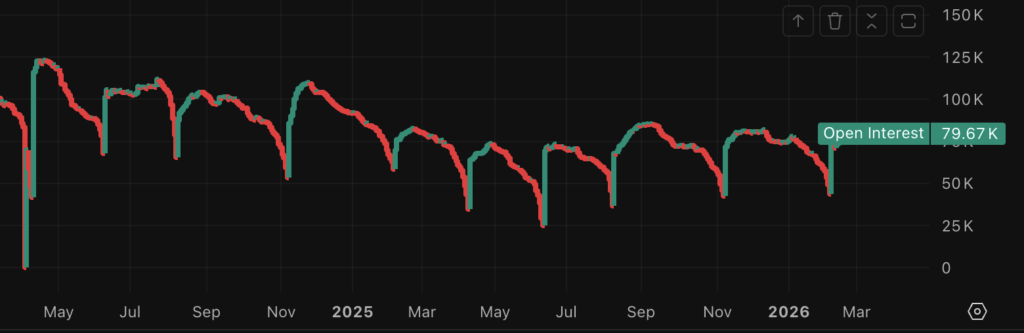
Looking only at front-month OI can produce misleading conclusions — especially during roll periods.
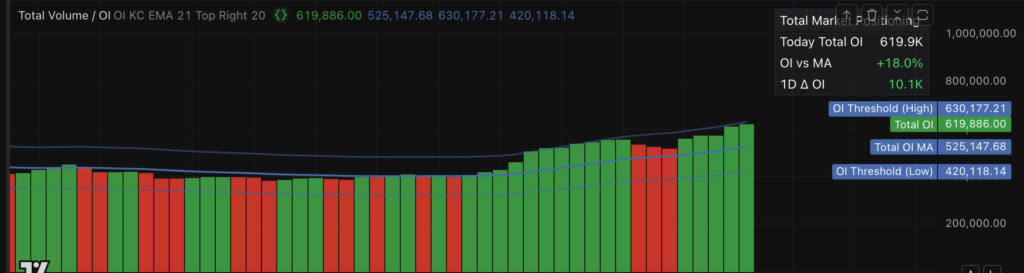
Total open interest across all expirations allows you to identify:
- Net new money entering the market
- True position reduction vs contract rotation
- Structural deleveraging
- Risk build-up ahead of major events
A drop in front-month OI during roll can look bearish — while total OI may actually be rising.
Those are two completely different narratives.
Even If You Don’t Trade Futures — This Still Matters
Futures markets often reflect institutional positioning before other asset classes adjust.
For example:
- Equity index futures often lead ETFs
- Bond futures reflect rate expectations before cash bonds
- Commodity futures reveal supply stress before producer equities react
Monitoring total futures participation can provide:
- Early macro signals
- Risk-on / risk-off clues
- Sector rotation insight
- Liquidity stress detection
You don’t need to trade the contract to benefit from the information.
Why This Data Isn’t Easy to Track
One practical challenge is that most charting platforms display volume and open interest per contract, not aggregated across all active expiries.
When you open a futures chart, you typically see:
- Front-month volume
- Front-month open interest
- Or a continuous contract that doesn’t reflect true total participation
For structural analysis, that’s incomplete.
Even on advanced platforms like TradingView, there isn’t a built-in way to automatically aggregate total volume and total open interest across the entire futures curve in a single view.
Unless you manually switch between contracts and calculate totals yourself, you are not seeing the full capital commitment in the market.
A Practical Solution
Because of this limitation, I developed a separate TradingView script that:
- Aggregates total volume across active expirations
- Aggregates total open interest
- Helps distinguish real participation growth from simple contract rolling
- Makes structural positioning shifts visible
The objective isn’t complexity — it’s clarity.
Instead of guessing whether activity is fading or merely migrating forward, you can monitor the true expansion or contraction of market participation.
https://www.tradingview.com/script/5hcCc6xr-Total-Futures-Volume-Open-Interest-Aggregated-Curve
What You Should Actually Track
Instead of looking only at:
- Volume (front month)
- Open interest (front month)
Track:
- Total volume across all active expirations
- Total open interest aggregated
- Distribution of OI along the curve
- Roll timing (early vs late migration)
- Structural shifts in term structure
Final Thought
Single-contract analysis is tactical.
Total futures curve analysis is structural.
If you want to understand:
- Where real money is moving
- Whether participation is expanding or contracting
- Whether positioning is building or rolling
You need to look at the entire curve — not just the nearest expiry.
Futures markets are not just trading vehicles.
They are positioning instruments.
And total volume plus total open interest reveal what the front contract alone cannot.